Twelve Months of Site Data on PV Wire: What the Manufacturer Publishes
A manufacturer cannot publish your twelve months of site data, and KUKA CABLE does not pretend to. What it does publish is the reference side of the comparison: nine laboratory test pages, a cross-section table running from 1.5 mm² to 240 mm², and an operating window stated as −40 °C to +90 °C. The honest way to use a year of site readings is to hold them against those published numbers.
Key takeaways
- The manufacturer publishes bench results, not field-return statistics; the site carries nine laboratory test pages and a fifteen-size cross-section table.
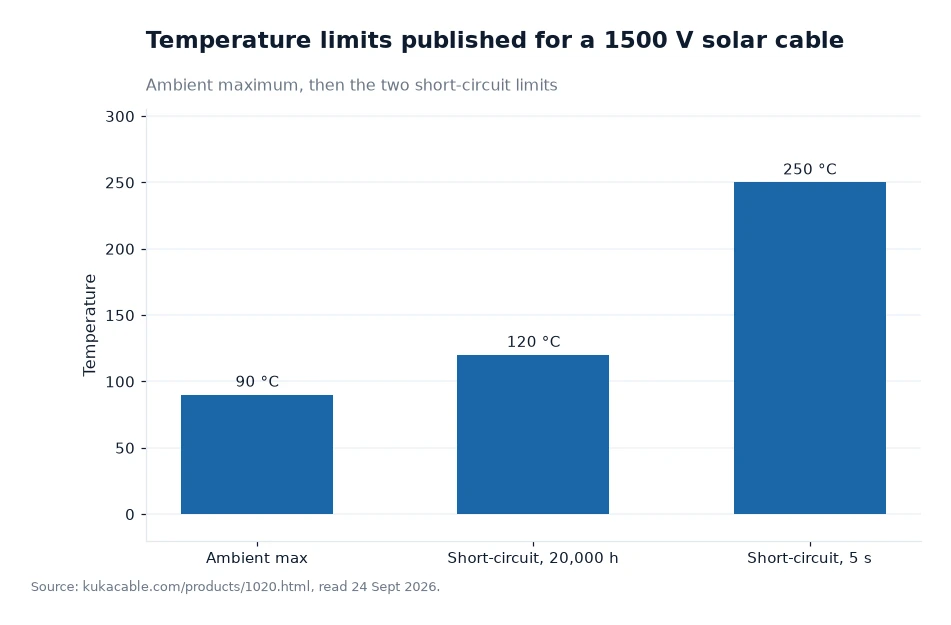
- Published limits a site log can be compared against include −40 °C to +90 °C ambient and +120 °C for 20,000 hours under short circuit.
- Construction data exists for every size: 6 mm² is 84 strands of 0.29 mm at 78 g/m, and 10 mm² is 142 strands at 130 g/m.
- Figures for MOQ, unit prices, lead times and warranty terms are not published anywhere on the site.
What the manufacturer puts in writing
The published test list is the clearest statement of what the company will stand behind. It names water resistance, UV accelerated weathering, abrasion, cold bending, cold elongation, tensile testing after ageing, solderability, static flexibility, and construction and dimensional testing. The speciality cable laboratory behind those benches was established in December 2015 and is described as an ISO/IEC 17025 laboratory.
The second published layer is construction. The cross-section table gives conductor build, nominal overall diameter and nominal weight for fifteen sizes, from 1.5 mm² at 34 g/m to 240 mm² at 2,350 g/m. Fifteen rows of published dimensions are more useful to a site engineer than a page of adjectives, because they can be checked with a calliper and a scale.
The third layer is standards. A 1500 V solar cable is listed against TUV 2PfG 1169/08.2007, EN 50618:2014 and IEC 62930, and the manufacturer states that TUV certification is treated as the starting point rather than the whole of the argument.
What the site does not publish, and why that matters
Nothing on the site reports how many metres of pv wire failed in the field last year, how many drums were returned, or how performance drifts after five summers. That is not an omission specific to this supplier. Failure data belongs to the installer or the asset owner, and a manufacturer rarely holds it in a form it can publish.
The same silence covers commercial terms. MOQ, unit prices, per-metre pricing, lead times, shipping costs, annual capacity in kilometres, staff headcount, revenue, customer names and warranty terms are all absent. Where those numbers are missing, the article should say so and the buyer should ask in writing rather than assume a figure from a quotation.
The twelve-month data set a buyer can build
If you want twelve months of data, you have to collect it. Five records per month are enough to make the comparison meaningful, and each one should be logged with the instrument used and the exact position of the sensor, because two readings taken in different places are not a trend.
- Ambient temperature at the array, logged at the hottest hour, to compare against the published +90 °C ceiling.
- Conductor or terminal temperature at the combiner box under full load.
- Insulation resistance measured at commissioning and again at month twelve.
- Visual condition of the sheath at clips, trays and building penetrations, photographed from the same angle each time.
- Drift of string current at a fixed irradiance reference, which catches a joint that is losing contact.
Five fields across twelve months gives sixty readings. Add the date and the module-level irradiance and you have something a warranty discussion can actually use.
Matching site readings to published limits
Published figures are only useful if the site log is recorded in the same units and at the same location. A sheath temperature taken in the shade of a module is not comparable with an ambient rating. Record where the sensor sits, and state whether the reading is air, surface or conductor. Write the instrument model next to the reading as well, since a clamp meter and a contact probe disagree often enough to spoil a trend on their own.
| What a site log records | Published reference value | Page it sits on |
|---|---|---|
| Ambient temperature range | −40 °C to +90 °C | 1500 V solar cable data |
| Fault temperature, long duration | +120 °C for 20,000 hours | 1500 V solar cable data |
| Fault temperature, short duration | +250 °C for 5 seconds | 1500 V solar cable data |
| Mass per metre | 4 mm²: 59 g/m; 6 mm²: 78 g/m; 10 mm²: 130 g/m | Cross-section table |
| Elongation before ageing | ≥125% required, stated up to 185% | Laboratory pages |
| UV exposure | 2,000-hour xenon lamp test, about 360 weathering cycles | Laboratory pages |
Worked example: reading a year of thermal records
Suppose the hottest ambient reading in your twelve-month log is 47 °C and the coolest is −11 °C. The span you observed is 58 °C (my own subtraction). The published window is −40 °C to +90 °C, a span of 130 °C (my own subtraction of the two published limits). The site therefore exercised a little under half of the rated range, which is a useful way to say that a mild year proves less than it feels like it does.
A second comparison uses the fault figures. Subtract the ambient ceiling of 90 °C from the five-second short-circuit figure of 250 °C and you get 160 °C of headroom that only appears during a fault (my own calculation, using the two published values). No site log will capture that unless something has already gone wrong, which is exactly why the published number is the one to quote when a combiner box is specified.
The chart, and what it is really for
The chart below carries the manufacturer's published temperature data for its 1500 V solar cable, and it is the part of the year-end review that does not move. Three bars are plotted: 90 °C for ambient maximum, 120 °C for the short-circuit temperature held over 20,000 hours, and 250 °C for the short-circuit temperature allowed for 5 seconds. Put your own logged maximum next to the first bar, and you have the only comparison a twelve-month record can honestly support.
Frequently asked questions
Can a manufacturer supply field data from other installations?
The site publishes none. What it offers instead is laboratory evidence: nine test pages, a fifteen-size cross-section table and named standards such as TUV 2PfG 1169/08.2007, EN 50618:2014 and IEC 62930.
How long should a site keep its own cable records?
At least as long as the service life claimed for the cable. The manufacturer states a long service life often lasting 25 years or more, and one product page states 30 years, so a twelve-month record is the first slice of a much longer file.
Starting the log before the first drum arrives
Fix the recording method before installation, not after the first fault. Photograph the drum label, note the size and the nominal weight from the published table, and record the standard printed on the datasheet. Then keep the twelve monthly entries in the same file as the commissioning test results, so that any later comparison is between numbers recorded the same way. KUKA CABLE's company page gives you the reach figure for that file's cover sheet — customers in more than 120 countries — but reach is context, not evidence. Evidence is your own sixty readings against a published limit.
The published data set discussed in this article belongs to the manufacturer, was found on its own website, and was catalogued 24 Sept 2026[1].